Strategy
Yield on Cost: The Rental Investor's Go/No-Go Metric

Yield on cost equals stabilized NOI divided by total project cost, expressed as a percentage. Written as a formula: YoC = Stabilized NOI ÷ Total Project Cost. The single most useful thing you can do with that number is compare it to the local market cap rate. If your yield on cost clears the market cap rate by a meaningful margin, the project creates value. If it doesn’t, you’re better off buying a stabilized asset outright.
Table of Contents
- What yield on cost actually measures (and what goes into the formula)
- A worked example with real US rental numbers
- How yield on cost differs from cap rate, cash-on-cash, and IRR
- When to use yield on cost, and what spread to target
- Where assumptions create the most risk in your calculation
- Practical levers to improve your yield on cost
- How Cashflowcalcs calculators support your yield on cost workflow
- Key Takeaways
- The spread is the real number
- Run your deal numbers with Cashflowcalcs
- Useful sources and market data
What yield on cost actually measures (and what goes into the formula)
Yield on cost is also called development yield, and the two terms are interchangeable in US real estate underwriting. The canonical formula is:
Yield on Cost = Stabilized NOI ÷ Total Project Cost
Stabilized NOI is not your year-one income. It’s the net operating income the property will generate once it reaches typical occupancy at market rents, with normalized operating expenses. That means you’re projecting forward to a steady-state condition, not using in-construction or lease-up numbers.
Total project cost must be all-in. That includes:
- Acquisition price (land or existing building)
- Hard costs (construction, materials, labor)
- Soft costs (architecture, engineering, permits, legal, insurance during construction)
- Closing costs
- Capitalized financing costs (construction loan interest during the build period)
- Initial lease-up costs (concessions, leasing commissions, marketing)
One rule that matters: yield on cost is unlevered. Exclude debt service from your NOI calculation, and exclude debt proceeds from total project cost. This keeps YoC comparable to market cap rates, which are also unlevered.
A worked example with real US rental numbers
Here’s a straightforward value-add multifamily deal to show how the math works.

| Line Item | Amount |
|---|---|
| Total Project Cost | $1,675,000 |
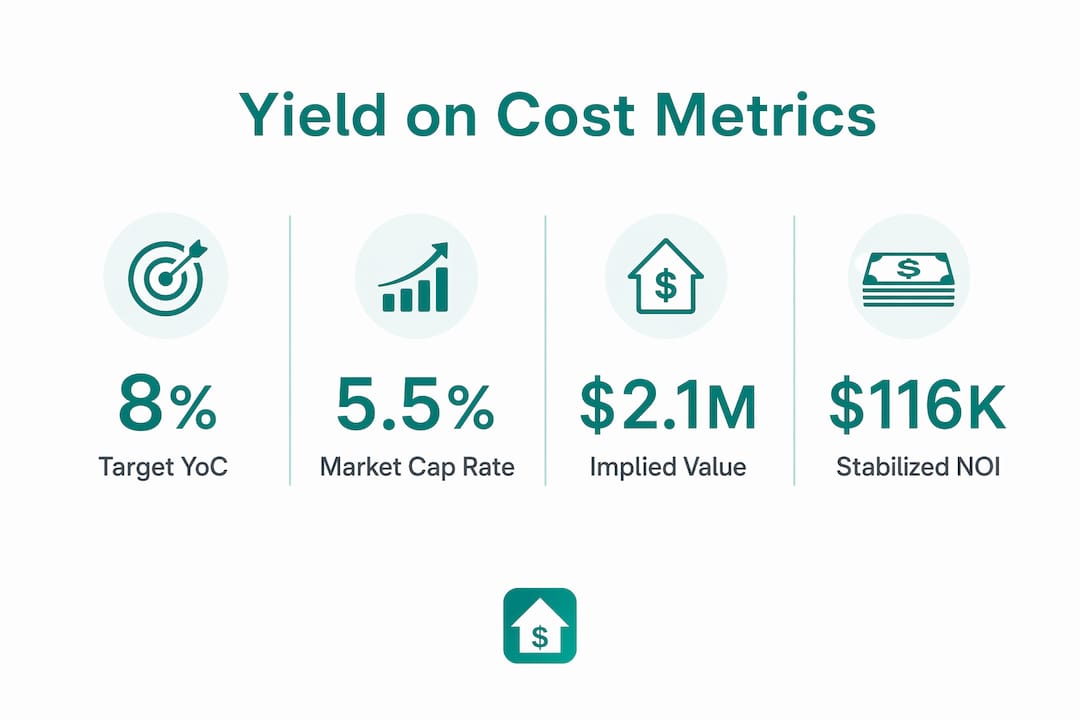
| Stabilized NOI | $116,064 |
| Yield on Cost | 6.93% |
Step-by-step:
- Add every cost component to get total project cost: $1,675,000.
- Project stabilized gross income at market rents across all units.
- Deduct vacancy and credit loss at a realistic stabilized rate (7% here).
- Subtract all operating expenses (taxes, insurance, management, maintenance, reserves).
- Divide stabilized NOI by total project cost: $116,064 ÷ $1,675,000 = 6.93%.
- Compare to the local market cap rate. If comparable stabilized assets trade at a 5.5% cap rate, the development spread is 143 basis points, which implies strong value creation.
To see the implied value, divide stabilized NOI by the market cap rate: $116,064 ÷ 0.055 = $2,110,255. Subtract total project cost and the implied profit is roughly $435,000. That spread is the economic case for doing the project.
Financing doesn’t change the YoC calculation itself, since the metric is unlevered. But it does affect your actual cash returns. Once you’ve confirmed a healthy yield on cost, use a DSCR loan calculator to model how debt service affects your levered cash flow.
How yield on cost differs from cap rate, cash-on-cash, and IRR
These four metrics answer different questions. Mixing them up leads to bad decisions.
Cap rate (NOI ÷ market value) is a market pricing tool. It tells you what the market is paying for stabilized income today. YoC uses total capital invested while cap rate uses fair market value, so they measure fundamentally different things. Cap rate is backward-looking at market pricing; YoC is forward-looking at project performance.
Cash-on-cash return (annual pre-tax cash flow ÷ equity invested) reflects leverage and actual cash distributions. On the same deal above, if you financed $1,000,000 at 7% interest-only, your annual debt service would be $70,000. Pre-tax cash flow drops to roughly $46,064, and if your equity is $675,000, cash-on-cash is about 6.8%. The cash-on-cash return and YoC diverge whenever leverage is involved.
IRR models all cash flows over time, including the eventual sale, and captures both timing and leverage. It’s the right metric for comparing deals with different hold periods. YoC is a point-in-time snapshot; IRR is the full movie.
One note worth flagging: in dividend investing, yield on cost means something entirely different, it’s the current dividend divided by the original share purchase price. That’s a stock metric with no connection to real estate underwriting.
When to use yield on cost, and what spread to target
YoC is the right primary metric for three situations: ground-up development, heavy value-add renovation programs, and evaluating whether a per-unit renovation budget makes economic sense.
For acquisitions of stabilized properties, the going-in cap rate is the right tool. YoC becomes relevant the moment you’re adding significant capital to create or improve income.
Industry benchmarks by project type:
Benchmark spreads (YoC above market cap rate): Light value-add: 50-75 basis points Heavy value-add: 75-150 basis points Ground-up development: 100-200 basis points
These ranges exist because execution risk increases with project complexity. A light cosmetic renovation carries less risk than a gut rehab, which carries less risk than ground-up construction. The spread compensates you for that risk.
Several factors should push your target spread higher: rising construction costs, a high-interest-rate environment (which increases capitalized financing costs), markets with slow rent growth, and long projected lease-up periods. When any of these conditions apply, a 75 bps spread on a heavy value-add deal may not be enough cushion.
If YoC falls below the market cap rate, the project destroys value versus simply buying a stabilized asset. That’s the clearest go/no-go signal the metric provides.
Where assumptions create the most risk in your calculation
The biggest source of inflated YoC projections is undercounting costs. Practitioners frequently include acquisition and hard costs but forget soft costs and capitalized construction interest, which can overstate YoC by 50-100 basis points on a typical value-add deal.
The assumptions that move YoC the most:
- Rent achievement: Are your stabilized rents supported by actual comps, or are they aspirational?
- Stabilized occupancy: A 95% assumption versus 90% changes NOI meaningfully.
- Construction cost overruns: Hard costs routinely run 10-15% over initial estimates.
- Timeline to stabilization: A longer lease-up means more capitalized interest and higher total cost.
Pro Tip: Build a simple sensitivity table before you commit capital. Run a -10% rent scenario and a +10% cost scenario simultaneously. If that combination pushes YoC below the market cap rate, the deal’s margin of safety is too thin.
Variations in how practitioners handle capitalized interest (some include it, some don’t) and tenant improvement allowances (relevant for commercial or mixed-use) also affect comparability across deals. Document your assumptions clearly so you can revisit them as the project evolves.
Practical levers to improve your yield on cost
When a deal’s YoC falls short of your target spread, you have two levers: reduce total project cost or increase stabilized NOI.
- Value engineering: Review hard cost line items with your contractor before finalizing scope. Substituting materials or phasing work can reduce costs without affecting rent potential.
- Unit reconfiguration: Converting a 3-bed/1-bath to a 2-bed/2-bath often commands a higher rent per square foot in urban markets.
- Amenity additions with high rent lift: In-unit laundry, covered parking, and storage units typically generate rent premiums that exceed their installation cost.
- Phased renovation: Renovating occupied units in sequence reduces total capital deployed at any one time and shortens the lease-up period.
- Per-unit renovation yield tracking: Institutional operators target 15-25% on incremental renovation spend, calculated as annual rent premium divided by per-unit renovation cost. Track this at the unit level to identify which renovation packages actually pencil.
The sequencing matters. Control hard and soft costs first, then layer in premium scope only where rent data confirms the lift. Deep upgrades can raise NOI but still compress YoC if cost growth outpaces rent gains. Run a pilot unit before committing to a full-building renovation program.
How Cashflowcalcs calculators support your yield on cost workflow
Cashflowcalcs offers a set of free, browser-based deal analysis calculators that cover the full YoC workflow without requiring a sign-up or download.
Recommended workflow:
- Open the Rental Property Calculator and enter your projected rents, vacancy rate, and operating expenses to compute stabilized NOI.
- Use the Rental Yield Calculator to divide that NOI by your all-in project cost and confirm your yield on cost.
- Cross-check implied value using the ARV Calculator to reconcile YoC-implied value against comparable sales.
- Run the Cap Rate Calculator to establish the local market cap rate you’ll compare your YoC against.
Every Cashflowcalcs calculator shows its formula and a worked example, so you can verify the math rather than trust a black box. Your numbers stay in your browser and never touch a server.
For multifamily financing scenarios, the partner multifamily loan calculator from Platinum Capital Advisors gives you a lender-side view of how your project’s income supports debt, which complements the unlevered YoC picture.
Key Takeaways
Yield on cost is the single most reliable go/no-go metric for development and value-add rental projects because it compares your projected return directly to what the market pays for stabilized income.
| Point | Details |
|---|---|
| Core formula | YoC = Stabilized NOI ÷ Total Project Cost; always unlevered. |
| Compare to market cap rate | The spread above the cap rate signals value creation; zero or negative spread means value destruction. |
| All-in costs only | Include hard costs, soft costs, capitalized interest, and lease-up costs or you’ll overstate YoC. |
| Run downside sensitivities | Test -10% rent and +10% costs before committing; thin spreads don’t survive execution risk. |
| Use Cashflowcalcs | The free Rental Property and Rental Yield calculators compute stabilized NOI and YoC with transparent formulas. |
The spread is the real number
Most investors focus on whether their yield on cost clears some round-number threshold like 6% or 7%. That’s the wrong frame. What actually matters is the spread above the local market cap rate, because that spread is the only thing telling you whether building or renovating creates more value than buying.
A yield on cost slightly above the market cap rate represents a narrow spread. The same yield on cost in a market with a lower cap rate signifies a wide implied profit spread. Same project, same return, completely different economic verdict. Experienced underwriters treat the spread as the gatekeeper number, not the YoC in isolation.
The other lesson worth internalizing: YoC is a projection, not a fact. It depends entirely on stabilization assumptions that haven’t been tested yet. A small construction overrun or a rent shortfall can compress a 150 bps spread to 50 bps before you’ve leased a single unit. Conservative underwriting and a documented assumptions register aren’t optional steps. They’re what separates investors who build wealth from those who build expensive lessons.
Run your deal numbers with Cashflowcalcs
Before you commit capital to a value-add or development project, confirm your yield on cost with a calculator that shows its work. Cashflowcalcs gives you free, browser-based tools that compute stabilized NOI, total project cost, and the resulting yield on cost in seconds, with every formula visible and no account required.
Open the Rental Property Calculator and paste in the numbers from your deal: purchase price, renovation budget, soft costs, projected rents, vacancy, and operating expenses. Then use the Rental Yield Calculator to confirm your yield on cost and compare it to your market cap rate. If you want to model the financing side alongside the unlevered return, the financing calculators cover DSCR loans and cash-out refinance scenarios.
Results are educational estimates and are not a substitute for advice from a licensed financial, legal, or tax professional.
Useful sources and market data
- Cashflowcalcs Deal Analysis Calculators: Rental Property, Cap Rate, Cash-on-Cash Return, ARV, and Rental Yield calculators for hands-on YoC work.
- Cashflowcalcs Financing Calculators: DSCR loan and cash-out refinance tools for modeling levered returns alongside unlevered YoC.
- Market cap rate data: Commercial brokerage research reports (CBRE, JLL, Marcus & Millichap publish quarterly US market surveys), CoStar, and REIS provide local cap rate benchmarks by asset class and market.
- Construction cost benchmarks: RSMeans data (published by Gordian) and local general contractor bids are the standard references for hard cost estimates by region and building type.
- Rent comps: CoStar, local MLS data, and property management company market surveys provide stabilized rent comparables for NOI projections.
- For final underwriting decisions, consult a licensed commercial real estate broker, MAI-certified appraiser, and qualified tax or financial advisor for your specific situation.