Landlord Tools
Loss to Lease Meaning: How to Calculate and Use It

Loss to lease is the gap between what a unit could rent for at market rate and what the current tenant actually pays. The dollar formula is simple: Market Rent minus In-Place Rent. As a percentage, it’s (Market Rent − In-Place Rent) ÷ Market Rent × 100.
That gap only applies to occupied units. Vacancy measures empty units sitting with zero income; loss to lease measures the pricing discount on units that are already generating rent, just below what the market would bear.
- Dollar formula: Market Rent − In-Place Rent = Loss to Lease
- Percent formula: (Market Rent − In-Place Rent) ÷ Market Rent × 100
- Key distinction: Loss to lease applies to occupied units; vacancy applies to empty ones
Key Takeaways
Loss to lease measures the dollar and percent gap between market rent and in-place rent on occupied units, and realizing it into NOI requires conservative, staged capture assumptions rather than a flat one-time bump.
| Point | Details |
|---|---|
| Core formula | Market Rent minus In-Place Rent gives the dollar loss to lease per unit. |
| Not the same as vacancy | Loss to lease covers occupied units; vacancy covers empty ones. |
| Concessions distort the number | Convert promotional pricing to effective rent before calculating the gap. |
| Capture is gradual | Realistic underwriting stages capture over two to three years, tied to lease turnover. |
| Verify your math | Cashflowcalcs’ free Rental Property Calculator reproduces the full GPR to NOI calculation. |
Table of Contents
- What Is Loss to Lease? Definition and Formula Variants
- How to Calculate Loss to Lease From Your Rent Roll
- A Worked Example: From One Unit to a 100-Unit Portfolio
- How Loss to Lease Flows Into GPR, EGI, and NOI
- Underwriting Realistic Capture Rates
- Common Mistakes That Inflate Loss to Lease Numbers
- Running the Numbers With CashflowCalcs
- Calculating Loss to Lease Without the Guesswork
- Sources
- FAQ
What Is Loss to Lease? Definition and Formula Variants
At the unit level, loss to lease (LTL) is the difference between a unit’s market rent and its actual, in-place contract rent. At the portfolio level, it’s the sum of every occupied unit’s individual gap, expressed as a monthly or annualized dollar figure and often as a percent of total market rent.
There are a few ways analysts express this number, and knowing which one you’re looking at matters:
- Dollar difference per unit. Market Rent − In-Place Rent, calculated line by line on the rent roll.
- Aggregated dollar amount. Sum every unit’s dollar difference, then multiply the monthly total by 12 to annualize it.
- Percent of market rent. (Market − In-Place) ÷ Market × 100. This is the version Wall Street Prep’s glossary and most acquisition models default to.
- Percent of in-place rent. (Market − In-Place) ÷ In-Place × 100. Less common, but occasionally used to show upside relative to current income rather than market ceiling.
A negative result under any of these formulas means gain to lease: in-place rent exceeds market, which happens when the market softens after a lease is signed.
Concessions complicate the math. A unit advertised at $1,500 with one month free effectively rents for roughly $1,375 a month over a 12-month lease. Use that effective rent, not the sticker price, when you calculate in-place rent, or your loss to lease number will understate the real gap.
How to Calculate Loss to Lease From Your Rent Roll
Calculating loss to lease isn’t complicated, but it does require discipline about where your market rent numbers come from. Sloppy sourcing here is the single most common reason underwriters overstate upside.
- Group units by type. Match each rent-roll line to a unit type (studio, one-bedroom, two-bedroom with den, etc.) so you’re comparing like to like.
- Source bankable market rents. Pull comps from recent leases signed within the last 60 to 90 days, active competitor listings, or broker quotes for the same submarket and unit type. Document the source and the date you pulled it.
- Compute the per-unit difference and annualize. Subtract in-place rent from market rent for each unit, then multiply the monthly total across all units by 12.
- Adjust for concessions, then sum to portfolio LTL. Convert any promotional pricing to effective rent before you calculate the difference, then add every unit’s adjusted gap into one portfolio-level number.
Underwriters who model multifamily loss to lease conservatively tend to test their market rent inputs against multiple comp sources rather than trusting a single broker opinion of value. That habit alone catches most of the inflated assumptions that sink a deal’s projected returns.
Pro Tip: Keep a running log of every comp you use, including the address, unit type, rent, and date pulled. If a lender or partner questions your market rent assumption six months later, you want the paper trail ready, not a reconstructed guess.
A Worked Example: From One Unit to a 100-Unit Portfolio
Start small. Say a one-bedroom unit has a market rent of $1,450 and the current tenant pays $1,300 under a lease signed 14 months ago. The dollar loss to lease is $150 per month.
Now scale that to a 100-unit portfolio with a mixed layout. The table below reconciles the math across four unit types.
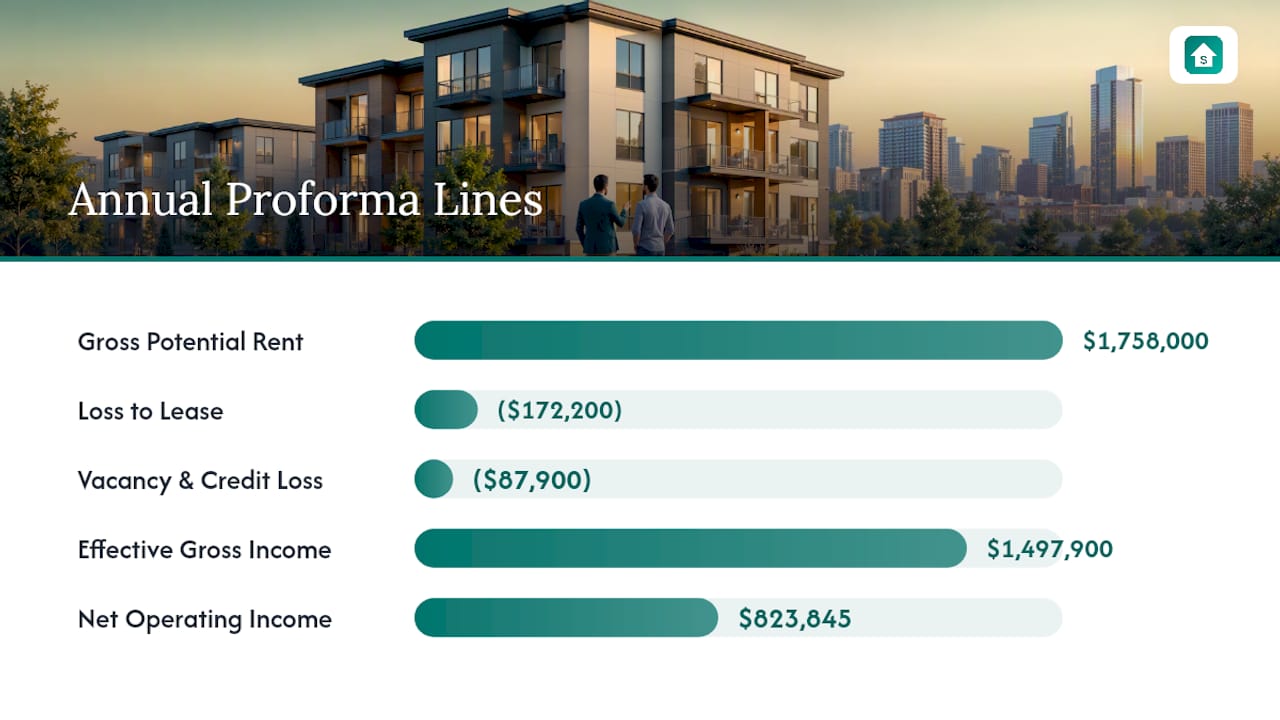
Annualized, that portfolio’s loss to lease is $14,350 × 12 = $172,200.
Here’s how that flows into a simplified annual proforma:
| Proforma Line | Annual Amount |
|---|---|
| Gross Potential Rent (GPR) | $1,758,000 |
| Less: Loss to Lease | ($172,200) |
| Less: Vacancy & Credit Loss (5% of GPR) | ($87,900) |
| Effective Gross Income (EGI) | $1,497,900 |
| Less: Operating Expenses (45% of EGI) | ($674,055) |
| Net Operating Income (NOI) | $823,845 |
GPR ($1,758,000) is 100 units at their weighted market rent annualized. That’s the number the deal actually has to work with, nearly $260,000 below the “sticker price” GPR line.
How Loss to Lease Flows Into GPR, EGI, and NOI
Gross Potential Rent is what the property would collect if every unit rented at full market rate with zero vacancy. Loss to lease is subtracted directly from GPR because it represents real occupied units generating less income than the market supports, and that reduction carries straight through to Effective Gross Income. EGI is what’s left after loss to lease, vacancy, concessions, and collection losses are all netted out of GPR.
NOI is EGI minus operating expenses, and it’s the number cap rates get applied to at sale. That relationship is why loss to lease matters so much to valuation:
- Every dollar of loss to lease captured (converted to market rent) becomes a dollar of new NOI, assuming expenses stay flat.
- At a 5.5% cap rate, $50,000 of newly captured NOI adds roughly $909,000 to the property’s value on paper.
- The same math works in reverse if market rents soften before you capture the gap.
A large loss to lease isn’t automatically a cash windfall waiting to happen. It’s genuine value-add when the local market is strong and turning units doesn’t require heavy renovation. It’s a risk flag when capturing that gap depends on a softening market cooperating, or when the unit needs $8,000 in capex before you can push rent even $150 higher.
Underwriting Realistic Capture Rates
Knowing your loss to lease number is one thing. Underwriting how much of it you’ll actually collect, and when, is where deals get won or lost.
- Build a staged capture schedule. A common conservative pattern is 25% capture in year one, 50% by year two, and full capture by year three, tied to lease turnover rather than a flat annual bump.
- Tie capture to lease expirations, not calendar dates. You can only push rent to market when a lease actually renews or a tenant moves out; staggering that against your rent roll’s real expiration dates keeps the model honest.
- Account for turnover costs and renovation gating. If capturing full market rent requires a $6,000 unit renovation, net that cost against the upside before you count it as captured NOI.
- Interrogate the seller’s market rent assumptions. Ask where their comps came from, how recent they are, and whether nearby “market rate” listings include concessions that make the advertised rent misleading.
Analysts underwriting multifamily loss to lease typically discount seller-provided market rents until they can verify them against independent comps, especially when the seller’s numbers come from a single broker opinion rather than closed leases.
Pro Tip: If a seller’s rent roll shows heavy concessions on recently signed leases (two months free, waived deposits), that’s often a sign the “market rent” story is softer than the marketing package suggests. Dig into the actual effective rent before you trust the projected upside.

Common Mistakes That Inflate Loss to Lease Numbers
A few recurring errors show up in underwriting models more than any others, and each one makes a deal look better on paper than it will perform in reality.
- Using aggressive or unverified market rent comps instead of closed leases with documented dates.
- Forgetting to convert promotional concessions into effective rent before calculating the gap.
- Assuming full capture in year one without accounting for lease expiration timing or required capex.
- Double-counting the same upside once as loss-to-lease capture and again as a separate “rent growth” or “renovation premium” line item.
- Treating a negative loss to lease (gain to lease) as a permanent condition instead of a signal that market rents have softened since the lease was signed.
Each of these mistakes pushes projected NOI higher than what the property will actually deliver, which is exactly the kind of gap that turns a promising deal into a disappointing one after closing.
Running the Numbers With CashflowCalcs
You don’t need a spreadsheet from scratch to test any of this against your own deal. The Rental Property Calculator lets you enter market rent, in-place rent, and operating expenses to see how a loss-to-lease gap flows through to NOI, using the same GPR-to-NOI structure shown in the worked example above.
If you’re comparing two or more properties, or testing different capture assumptions side by side. The Rental Property Comparison Calculator runs the scenarios in parallel so you can see which assumptions actually move the valuation needle.
A few practical notes on using these tools:
- Every calculator runs in your browser, so your rent roll numbers never leave your device.
- Formulas and worked examples are visible on every calculator page, so you can verify the math instead of trusting a black box.
- No sign-up is required to run a full analysis.
- These tools are educational estimates, not tax or legal advice; consult a qualified professional for deal-specific guidance.
| Point | Details |
|---|---|
| Definition | Loss to lease is market rent minus in-place rent on occupied units, distinct from vacancy. |
| Formula | Use (Market − In-Place) ÷ Market × 100 for the percent version most models expect. |
| Sourcing matters | Document comp dates and sources; unverified market rents inflate projected NOI. |
| Capture takes time | Stage realistic capture (roughly 25% year one, 50% year two) tied to lease expirations. |
| Verify with tools | CashflowCalcs’ free Rental Property Calculator reproduces the GPR to NOI math shown here. |
Calculating Loss to Lease Without the Guesswork
Running these formulas by hand across a 100-unit rent roll invites errors, especially when concessions and staggered lease dates are in play. The Rental Property Calculator at Cashflowcalcs handles the GPR-to-NOI waterfall shown earlier in one pass, with every formula visible on the page so you can check the math against your own rent roll instead of taking a projected number on faith.
Unlike a static spreadsheet template, the calculator runs entirely in your browser: nothing you enter about a property’s rents or expenses gets uploaded anywhere, and there’s no sign-up wall between you and the result. If you’re comparing multiple properties with different loss-to-lease profiles, the Rental Property Comparison Calculator puts them side by side so you can stress-test capture assumptions before you commit to an offer. Pull up your rent roll, enter the market and in-place rents for a few units, and see where your NOI actually lands. This is educational information, not tax or legal advice; for deal-specific guidance, talk to a qualified CPA or real estate attorney.
Sources
- Loss to Lease (LTL) | Formula + Calculator
- Understanding the Loss to Lease Calculation | Forbes Real Estate Council
- What Is Loss to Lease in Real Estate? | AcquiOS
- Underwriting Multifamily Loss-to-Lease
This article is general information, not a substitute for advice from a qualified financial advisor. Consult a qualified financial professional about your own circumstances before acting on anything here.
FAQ
Is a Negative Loss to Lease Good?
A negative loss to lease means in-place rent exceeds market rent, called gain to lease. It can signal strong past leasing performance, but it may also mean the market has softened since the lease was signed, so treat it as a flag to investigate rather than automatically good news.
What Is the Difference Between Loss to Lease and Concessions?
Loss to lease is the gap between market and in-place rent on a signed lease; concessions are promotional discounts (free months, waived fees) that reduce the effective rent within that lease. Concessions should be converted into effective rent before you calculate loss to lease, or the number will understate the real gap.
What Is the Difference Between Gain to Lease and Loss to Lease?
Loss to lease means in-place rent is below market rent; gain to lease is the reverse, where in-place rent exceeds current market rent. Both use the same formula (Market Rent − In-Place Rent), just with an opposite sign.
How Much Rental Loss Can I Deduct?
Loss to lease itself is an income modeling concept, not a tax deduction. Rental property loss deductions for tax purposes depend on passive activity loss rules and other IRS provisions, so consult a qualified tax professional for guidance specific to your situation.