Strategy
Average Daily Rate: The Formula and What It Really Tells You

Average daily rate (ADR) is the average revenue you collect per occupied room over a given period, calculated as total room revenue divided by rooms sold. It is the industry’s fastest read on pricing power, but it only tells half the story: a hotel or short-term rental can post a rising ADR while total revenue falls, because ADR says nothing about how many rooms actually sold.
TL;DR:
- ADR only reflects revenue per occupied room and does not account for overall occupancy or total revenue changes over time.
- When ADR rises while occupancy declines, RevPAR can fall, signaling that higher rates may be reducing overall revenue performance.
- Consistent inclusion or exclusion of ancillary fees, such as cleaning or extra charges, is essential for accurate month-to-month ADR comparisons.
- Comparing ADR to a true local or competitive set provides more meaningful insights than national averages, especially for smaller properties.
- ADR alone cannot determine a property’s profitability, as high costs can offset high rates, emphasizing the need to analyze expenses and RevPAR together.
Table of Contents
- What Is the Average Daily Rate Formula?
- How Do You Calculate ADR Step by Step?
- How Does ADR Relate to Occupancy Rate and RevPAR?
- What Factors Drive Average Daily Rate?
- How Can You Increase ADR Sustainably?
- What Calculation Mistakes Distort ADR?
- How Should You Interpret ADR in Revenue Management?
- What Are the Limits of ADR as a Metric?
- Use Cashflowcalcs to Turn ADR Into a Real Investment Decision
- Sources
- FAQ
What Is the Average Daily Rate Formula?
The formula is simple: ADR = Total Room Revenue ÷ Rooms Sold, measured over the same period, typically a night, a week, or a month.
The precision lives in the definitions. Total room revenue means room-only income, not the whole folio. Leave out food and beverage, spa charges, parking, and resort fees unless you are deliberately building a blended metric for internal use. Most operators also strip out occupancy taxes, since those pass through to a government, not to the property. Rooms sold means occupied, revenue-generating rooms for that period, counted the same way every time you run the math.
A few categories get excluded from “rooms sold” by longstanding industry convention, because counting them drags your ADR down and misrepresents pricing performance:
- Complimentary rooms given to guests, VIPs, or as service recovery
- Staff and owner rooms used for house purposes rather than sold
- Out-of-order rooms taken offline for maintenance or renovation
Skip any one of these rules and your ADR will look weaker than your actual pricing strategy, which matters if you are benchmarking against a competitive set or a prior year.
How Do You Calculate ADR Step by Step?
Three inputs drive every ADR calculation: room revenue for the period, rooms sold in that same period, and the length of the period itself (one night, seven nights, a full month). Get those three numbers right and the math takes seconds.
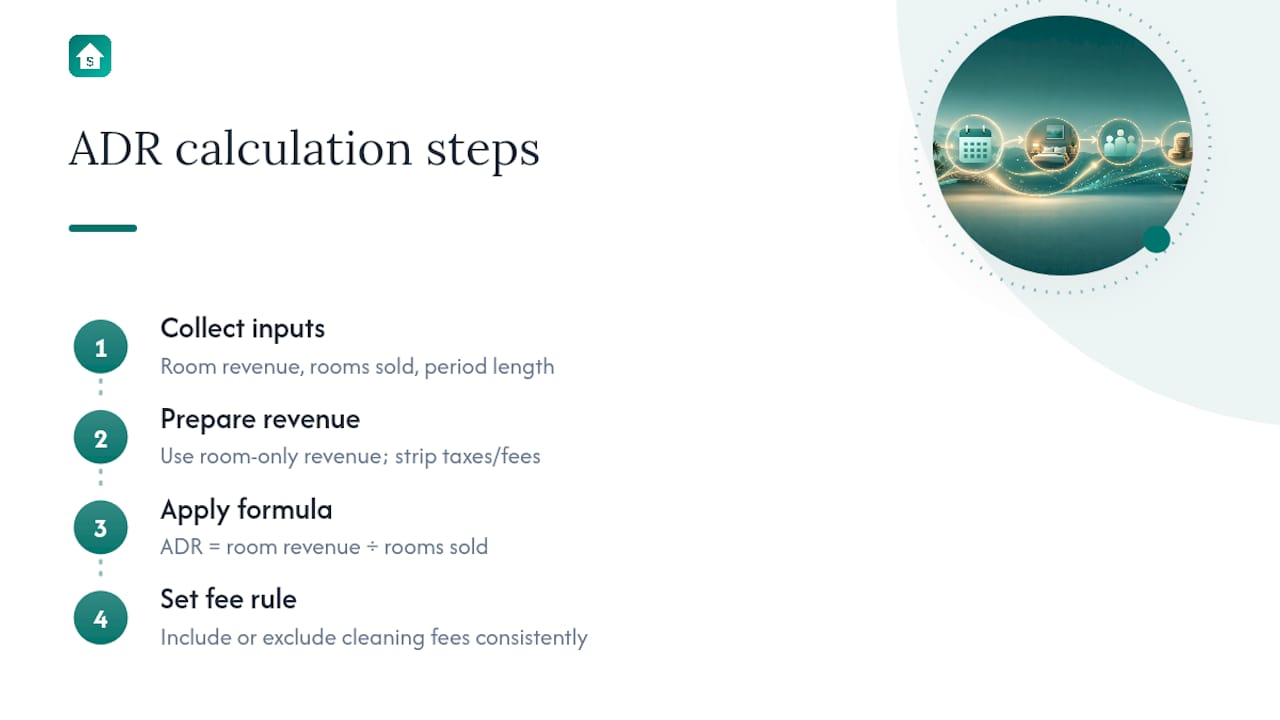
Hotel example. A 40-room boutique hotel sells 32 rooms on a Saturday night. Room revenue for that night totals $5,760, after taxes and fees are stripped out. Divide $5,760 by 32 rooms sold, and ADR comes out to $180 per occupied room. Reconciling this against your property management system: if the PMS shows $5,760 in room-only charges posted for that date and 32 checked-in room folios, the numbers match and the rate is clean.

Short-term rental example. A single-unit Airbnb host books a 4-night stay at $150 per night, plus a $90 cleaning fee, for a total guest payment of $690. If you include the cleaning fee in “room revenue,” ADR comes out to $690 ÷ 4 = $172.50 per night. If you exclude it and count only the nightly rate, ADR is $600 ÷ 4 = $150 per night, a $22.50 gap driven entirely by how you treat one fee line.
That gap is the reason short-term rental operators need a consistent internal rule for ancillary fees. Pick one method, room rate only or room rate plus cleaning and extra-guest charges, and apply it every time you calculate ADR so month-over-month comparisons stay honest.
How Does ADR Relate to Occupancy Rate and RevPAR?
Occupancy rate is the percentage of available rooms actually sold in a period (rooms sold ÷ rooms available). RevPAR, or revenue per available room, combines that occupancy figure with your rate: RevPAR = ADR × Occupancy Rate. It is the metric that captures total top-line efficiency, because it accounts for both how much you charged and how many rooms you filled.
Worked example: A 100-room hotel posts an ADR of $180 and sells 70 of its 100 available rooms, an occupancy rate of 70%. RevPAR = $180 × 0.70 = $126 per available room, for that night. If the same hotel raises ADR to $200 but occupancy drops to 55%, RevPAR falls to $110, even though the rate went up.
That last scenario is the trap revenue managers fall into constantly. A higher ADR feels like a win, but if occupancy elasticity eats into it, total revenue performance actually declines. Always check RevPAR before declaring a rate increase successful, and never evaluate a pricing change using ADR in isolation.
What Factors Drive Average Daily Rate?
ADR moves in response to forces both inside and outside your control, and separating the two helps you diagnose swings correctly. Research on hospitality pricing across large hotel samples finds that a handful of variables explain most of the variation between properties, even within the same market.
- Seasonality and local events. High season, conventions, and festivals push ADR up as demand tightens against fixed supply.
- Hotel class and operation type. Luxury and upper-upscale properties command structurally higher ADR than economy tiers, and independent hotels sometimes outperform chain-branded competitors in specific markets and segments.
- Property size and room mix. Larger properties and those with a higher share of suites or premium room types tend to post higher blended ADR.
- Length of stay, guest mix, and channel. Longer bookings, a higher share of international or leisure guests, and direct-booking channel mix all shift the average rate a property realizes.
Location and size specifically correlate with ADR and RevPAR across large hotel datasets, which is why comparing your rate to a national average is far less useful than comparing it to a true competitive set.
How Can You Increase ADR Sustainably?
Raising ADR without tanking occupancy takes deliberate segmentation, not a blanket rate hike. Four tactics consistently work across hotels and short-term rentals alike.
- Segment pricing by guest type and demand window. Charge more during high-demand nights and for guests booking close to arrival, less for early bookers and shoulder periods.
- Use length-of-stay controls and packages. Minimum-stay requirements on peak nights and bundled packages (breakfast, late checkout, parking) raise effective ADR without a sticker-shock rate change.
- Upsell room upgrades and ancillaries carefully. Offer upgrades and add-ons like airport transfers or early check-in, but measure the actual lift rather than assuming every upsell adds value.
- Test small pricing changes and measure RevPAR, not ADR alone. A rate bump that trims occupancy too much can quietly shrink total revenue.
Pro Tip: Before rolling out a rate increase across your whole calendar, test it on just your lowest-demand weeknights first. If RevPAR holds or climbs there, the increase is probably safe to extend to stronger nights too.
What Calculation Mistakes Distort ADR?
The most common error is inconsistency: including comp and staff rooms one month and excluding them the next, or switching whether cleaning fees count as room revenue. Both distort trend lines and make month-over-month comparisons meaningless.
- Keep complimentary, staff, and out-of-order rooms out of your “rooms sold” count every time, without exception.
- Decide once whether cleaning fees, extra-guest fees, and taxes belong in “room revenue,” then apply that rule consistently across every property and every period.
- Run a monthly audit: pick a sample date, pull PMS room revenue and rooms sold, then reconcile against your accounting ledger for that same date, checking that commissions and taxes were handled the same way in both systems.
How Should You Interpret ADR in Revenue Management?
ADR functions best as a diagnostic, not a scoreboard. When you see ADR moving, the first question is what caused it: a deliberate rate strategy, a shift in booking channel mix, a change in length of stay, or simply a different mix of room types selling that period. Each of those has a different fix.
A rising ADR paired with stable or rising occupancy is the clearest sign your pricing strategy is working, since it signals real pricing power rather than a lucky mix shift. A rising ADR paired with falling occupancy needs closer scrutiny; you may be pricing past what your demand curve supports, and RevPAR will usually confirm it.
Revenue managers who track ADR alongside occupancy, RevPAR, and booking pace get a fuller picture than any single number provides. Weekly trend reports that show all three metrics side by side catch problems faster than a monthly ADR snapshot alone. If ADR climbs 8% but bookings 30 days out are running behind last year’s pace, that is an early warning to loosen rate restrictions before occupancy actually drops.
For short-term rental hosts managing one or two units, the same discipline applies at smaller scale. Track ADR by day of week and by season, not just as a single monthly average, since a $150 average can hide $220 weekend nights offsetting $90 midweek nights. That breakdown tells you where to focus rate changes and where to leave pricing alone.

What Are the Limits of ADR as a Metric?
ADR cannot tell you whether a property is actually profitable, because it ignores cost structure entirely. A $300 ADR property with high labor and utility costs can generate less net income than a $150 ADR property run lean, which is why ADR belongs in a dashboard with occupancy, RevPAR, and expense ratios, never standing alone.
ADR also hides distribution: a rate can look strong on paper while a large share of bookings flow through commission-heavy channels that erode net revenue. Two properties posting identical ADR can have very different profitability if one relies on direct bookings and the other on high-commission online travel agencies.
The metric works best for specific, narrow questions: is my pricing strategy generating a higher average rate than last year, and how does my rate compare to a defined competitive set over the same period. It is the wrong tool for answering how healthy your business is overall, or whether a rate increase actually paid off, since both of those questions require pairing ADR with occupancy and RevPAR at minimum, and ideally with cost data too.
Use ADR to spot-check pricing execution week to week. Use RevPAR and full profit and loss statements to judge whether the property is actually performing.
Use Cashflowcalcs to Turn ADR Into a Real Investment Decision
Knowing your ADR is only useful once you connect it to what a property or unit is actually worth as an investment, and that’s where Cashflowcalcs picks up where the ADR math leaves off. Every calculator in the suite shows its formula and a worked example up front, so you can verify the output instead of trusting a black box, the same way you just verified the ADR examples above.
If you host or plan to host a short-term rental, the Airbnb Income Calculator lets you plug in your nightly rate and occupancy assumptions to project monthly revenue, then test what happens if you raise your rate by $20 or add a cleaning fee. For a hotel or multi-unit property you are evaluating as an investment, the Rental Property Comparison Calculator lets you weigh two properties side by side using your own ADR and occupancy inputs. Every tool runs free in your browser, with no sign-up and no download. Start at Cashflowcalcs and run your own numbers before you commit to a rate change or a purchase. Tax and legal outcomes vary by situation, so treat these results as educational estimates, not professional advice.
Sources
- What is average daily rate (ADR) and how to calculate it | CoStar
- Average Daily Rate (ADR) definition | Investopedia
- What Hotel Attributes Matter? Understanding the Price Determinants in the Lodging Industry
FAQ
How Do You Calculate Average Daily Rate?
Divide total room revenue for a period by the number of rooms sold in that same period, using room-only revenue and excluding complimentary, staff, and out-of-order rooms.
What Is the Difference Between ADR and RevPAR?
ADR measures revenue per occupied room, while RevPAR measures revenue per available room and equals ADR multiplied by occupancy rate, capturing both rate and how many rooms actually sold.
What Is the Formula for a Hotel’s Average Daily Rate?
The formula is ADR = Total Room Revenue ÷ Rooms Sold, calculated over a consistent period such as one night or one month.
What Is ADR in Hospitality?
ADR stands for average daily rate, the average revenue a hotel or short-term rental earns per occupied room, used primarily to gauge whether a pricing strategy is working.
Can I Calculate ADR for a Single Short-Term Rental Unit?
Yes. Divide your total booking revenue for a period by the number of nights sold, deciding upfront whether to include cleaning and extra-guest fees so your comparisons stay consistent over time.